Improving at putting is for a lot of people one of the most difficult things in golf. This is can be linked with inadequate knowledge of the building blocks of good putting and how they relate to each other.
These building blocks can be divided in 3 main categories: the ability to start the ball on the intended start-line, the ability to hit the putt with the correct speed (distance control) and green reading.
But for different putts and for different golfers, the interplay of the 3 putting categories changes. For instance, on a straight 2.5 m putt, speed is significantly less important since you can make the putt with both drop speed and by ramming it with full speed in the back edge of the hole. In contrast, if the start direction is off with 1° or you’ve miss-read the putt with 0.4% slope, you will miss the putt. On the other hand, for a downhill-slider any significant error with the speed or green reading will result with a missed putt.
To be able to make meaning full distinctions for the best approach to improve anyone’s putting on an individual level, and to still take everything into consideration about the 3 putt categories, we will use the Putt Analyser in found in the tGAT app (the math behind the analysis will be published in a separate article).
The Putt Analyser uses 3 values, one for each putt category, to describe the skill of a golfer’s putting. The value which it uses is the standard deviation (SD), which for simplicity can be seen as the average error multiplied by 1.25. For example, if your average start direction error is 0.6° then your start direction SD is 0.75°. For speed (distance control) the error is instead measured in percent difference of the distance. For example, for a target of 3 m a 10% error means a roll-out distance error of 30 cm (either long or short). Lastly, green reading is measured with an error in percent incline of the putting surface.
We will continue the analysis using values for an elite golfer but keep in mind that by doing a few tests with the tGAT app you can find your own SD for the 3 categories.
| Putt category | Standard deviation (SD) |
| Start direction | 0.6° |
| Speed | 6% |
| Green reading | 0.45% |
To begin, with only the 3 SD values we can find the one-putt probability (make-rate) for any putt. This means that for putts on a stimp 11 green with side slope of 2%, elevation of 0% and distances from 1 to 4 m, we can see the following result.
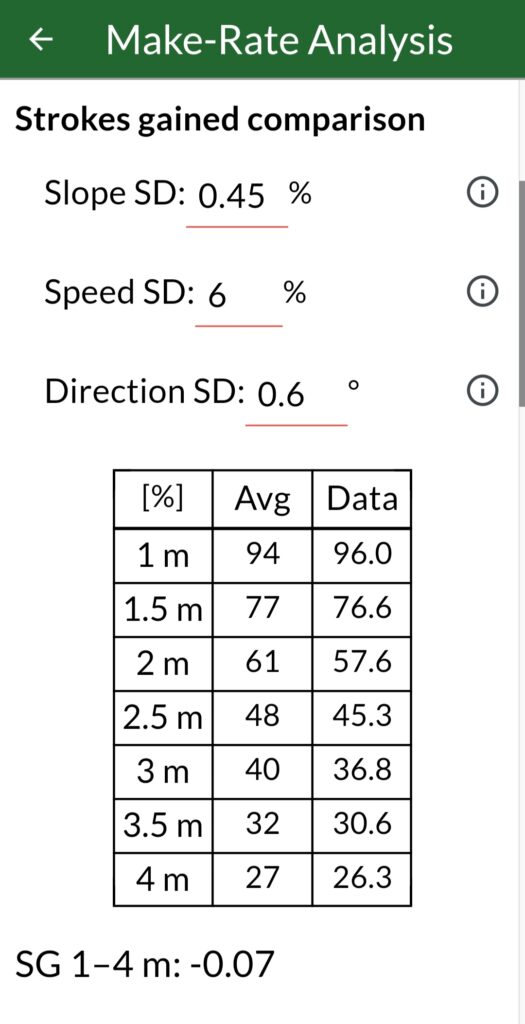
In the column Avg we have the PGA Tour average make-rate and in the Data column we have the predicted make-rate from the SDs. This gives a strokes gained prediction for the elite golfer of -0.07 shots per 18 holes of golf. In other words, the elite golfer is approximately a PGA Tour average putter.
We can also find the relative importance for the 3 putt categories from a strokes gained perspective.
| Putt category | Relative importance |
| Start direction | 17% |
| Speed | 13% |
| Green reading | 71% |
This means that the elite golfer with the 3 SD values can gain the most amount of shots by improving their green reading.
However, looking at different individual putts the relative importance is very different. Firstly, for the 1 m putt in the stokes gained example the relative importance for direction is higher.
| Putt category | Relative importance |
| Start direction | 25% |
| Speed | 8% |
| Green reading | 68% |
If we instead look at a 3 m putt with slope of 2% and elevation of -2% (downhill-slider) the relative importance for direction is significantly lower.
| Putt category | Relative importance |
| Start direction | 2% |
| Speed | 10% |
| Green reading | 88% |
For the presented relative important cases, it is possible to say that improving green reading for the elite golfer will give most improvement to the to the putting since the relative importance for green reading is the highest.
Potential score improvement
Example “High handicapper”
To see exactly how improvement in the different categories will affect putting performance we will do a potential score improvement analysis for a new fictional golfer (high handicapper) with new SD values.
| Putt category | Standard deviation (SD) |
| Start direction | 1° |
| Speed | 10% |
| Green reading | 0.55% |
The strokes gained approximation for these SD values is -1.38 shots in the 1–4 m range over 18 holes. If we now exchange each putt category with the SD of the elite golfer in that category, we can see the potential score improvement of that category. For instance, if the SD of start direction is changed to 0.6° (value of elite golfer) the strokes gained approximation is improved to -1.01 shots which gives a score improvement of 0.37 shots over 18 holes.
| SD combination | Strokes gained | Score improv. |
| High handicapper | -1.38 | 0 |
| Elite start direction | -1.01 | 0.37 |
| Elite speed | -1.12 | 0.26 |
| Elite green reading | -0.94 | 0.44 |
| Elite all categories | -0.07 | 1.31 |
From Table 6 it is seen that improving green reading for the fictional golfer will give the most positive contribution to improving the score. It is also possible to see that the sum of each individual category improvement 0.37+0.26+0.44=1.07 is less than the score improvement of elite golfer in all categories of 1.31. This means that there is an additional 0.24 shots to be gained by simply improving in all categories (this comes from a mathematical property when “adding” standard deviations). The consequence from this is that it still important to work on all categories to have the best possible improvement.
Example “Elite golfer”
To make a similar analysis for the elite golfer from before, we need to introduce new SD values for comparison of a “best possible putting level”. Based on own experience with the tests from tGAT done by elite golfers, such a level can be determined to the values in Table 7.
| Putt category | Standard deviation (SD) |
| Start direction | 0.4° |
| Speed | 4% |
| Green reading | 0.3% |
One thing to note is that the tests done using tGAT are all in a controlled environment (relative to course play) which means that even with these “best possible” test result the equivalent on course SD is expected to be higher. The values does however still work for the analysis.
| SD combination | Strokes gained | Score improv. |
| Elite golfer | -0.07 | 0 |
| Best start direction | +0.1 | 0.17 |
| Best speed | +0.08 | 0.15 |
| Best green reading | +0.88 | 0.95 |
| Best all categories | +1.37 | 1.44 |
Table 8 indicate that elite golfer has the most shots to gained by improving their green reading. This is supported by the significantly higher relative importance of green reading for elite golfer in the strokes gained example (Table 2).
Conclusion
With the Putt Analyser page in the tGAT app it is possible to effectively pinpoint which putt category that can cut the most shots from your putting. The Putt Analyser can also help give perspective on the best way to tackle a new putt with relative importance ratios. For example, if you have a downhill-slider, there is more to be gained by carefully reading the putt and focusing on hitting the putt with the correct speed rather than to just get the start direction prefect. Likewise, for short straight uphill putts you will see that start direction becomes a greater factor in determining the putt outcome. Lastly, the Putt Analyser give a clear indication that most golfers will be able to gain the most amount of shots by improving their green reading.
Further reading
To learn more about green reading see Reading greens with tGAT and 2-plane green reading. It is also possible to save shots by using Optimal putting speed.
2 thoughts on “What is the best way to improve your putting?”