Welcome to the home page for The Golf Analysis Toolbox (tGAT).
Available on the App Store and Play Store.
YouTube channel for more tutorials.
tGAT is a comprehensive digital toolbox for golf available directly in your smartphone, designed to help remove the guessing out of your golf game. It covers a new scientifically based green reading system that accurately lets you decide an aim-line and all the necessary steps to mastering the method. The factors that it includes are distance, slope (side-to-side and up-down), wind deflection and grain. Furthermore, tGAT contains putt and wedge tests which are used to create a representative model for your game and highlight key areas for improvement. Additionally, there is a 3D ball flight program where you can analyse how wind affect ball flight characteristics such as carry, height, curve and decent angle for different launch conditions. There is also a simple tee strategy page. On top of all of this, you will also find putting exercises with comparative rating and the possibility to create new exercises with comparative rating.
Following is a sequence of pictures from tGAT.
Figure 1: The basic principles for the green reading system. Enter 4 parameters and get an aim-line for the break of the putt. The parameters are distance, incline of green side-to-side (slope positive right-to-left), incline of green up-and-down (elevation positive uphill) and lastly the stimp reading. The “Custom” page in tGAT give both aim-line for drop speed and for a speed of 40 cm past the hole.
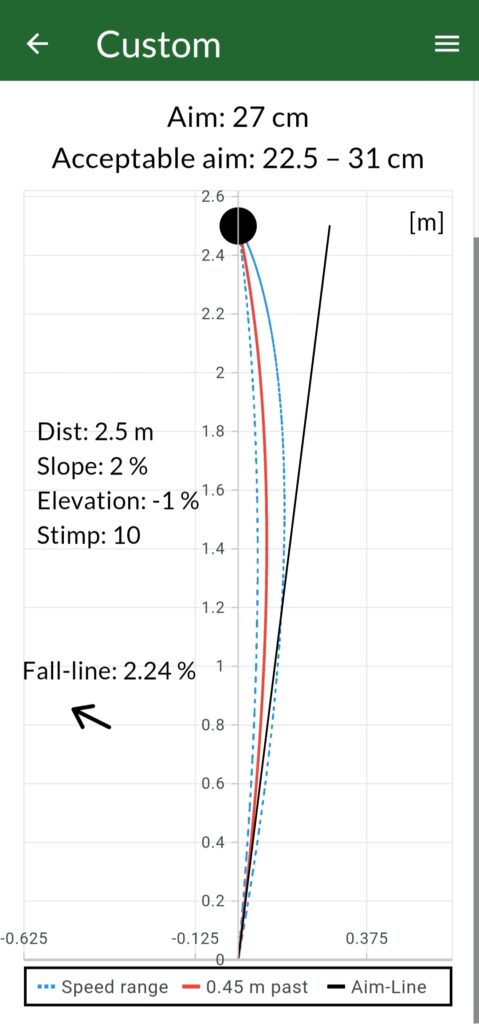
Figure 2: With the Putt Analyser in tGAT you can see your expected make rate for any putt given your standard deviation from different tests in the app. Most notably there is a Estimate Slope Test where you can practice feeling slope with your feet or visually. From it you can see your accuracy based on amount of slope and the left or right direction of the break. You will also get your tendency of missing left or right and over/under reading different putts.
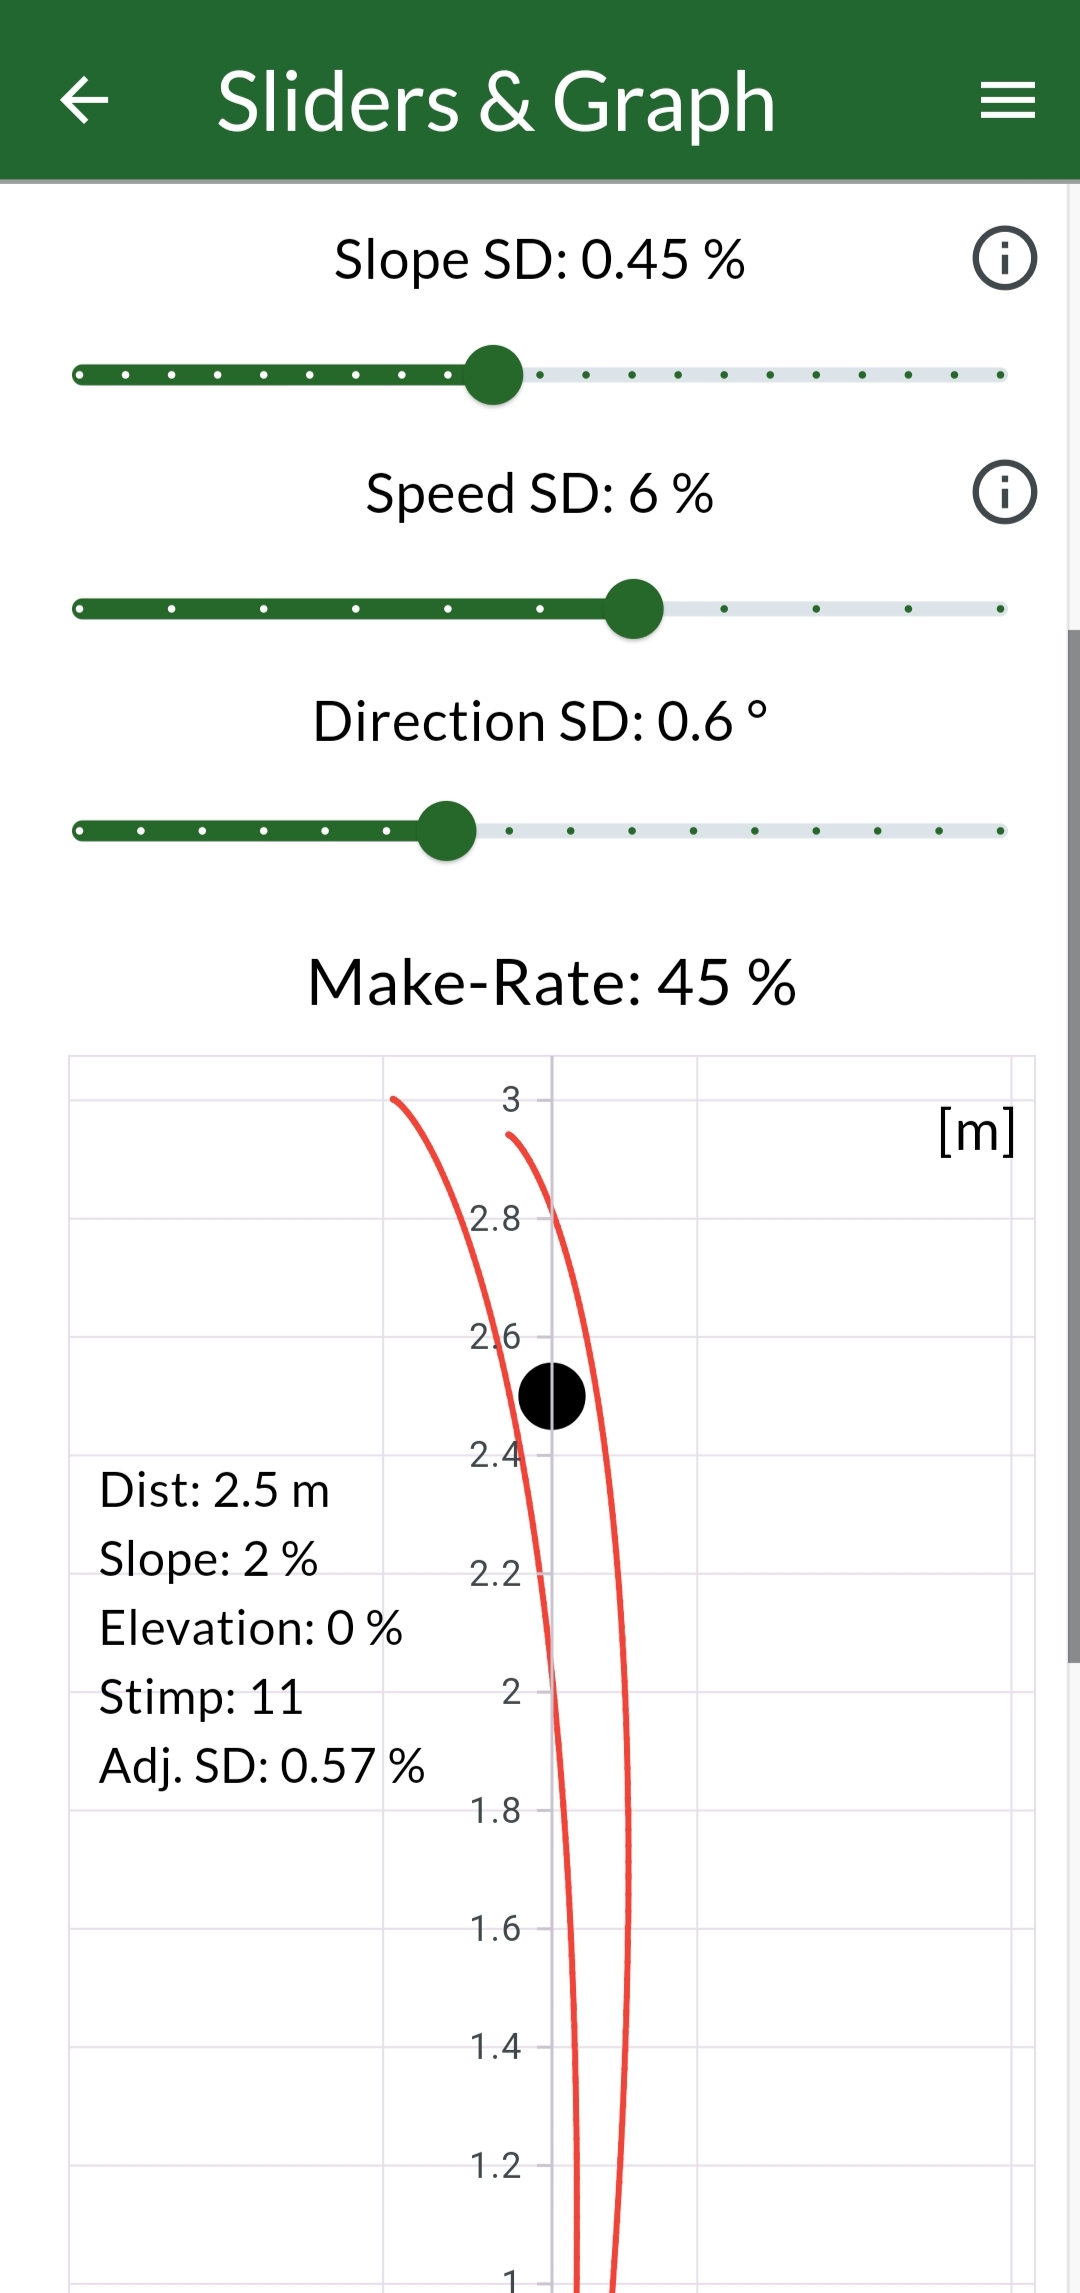
Figure 3: Reading Test where you get the 4 parameters for calculating break. Objective is to make as many putts as possible by guessing the aim correctly. A score is then given by reading accuracy and time taken for each read. A statistics page track progression and high score.
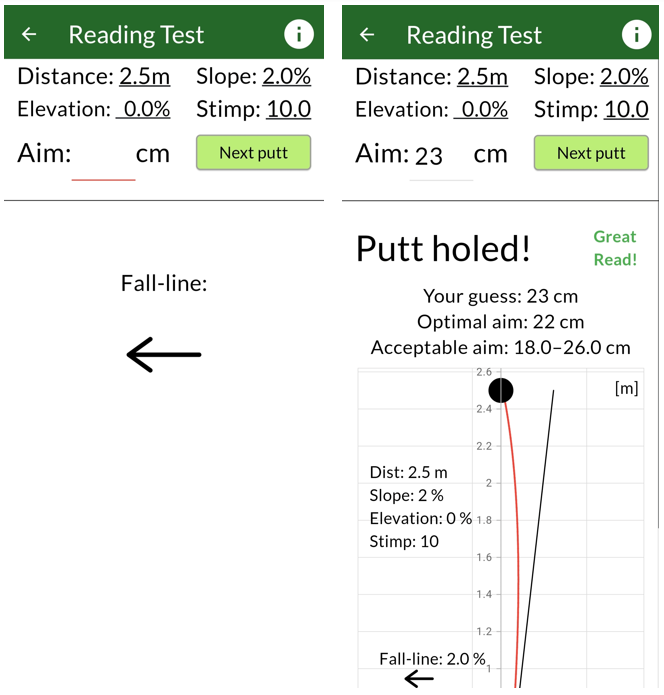
Figure 4: Layout for putt test statistics. The 3 available test follow the putt importance idea. The stats page give results for the given tests and a comparison to PGA Tour averages and PGA Tour best for those tests. Likewise for make rate statistics for each distance and a total strokes gained estimate for 3–10 feet. #Tests/#Putts is an indication of sample size.
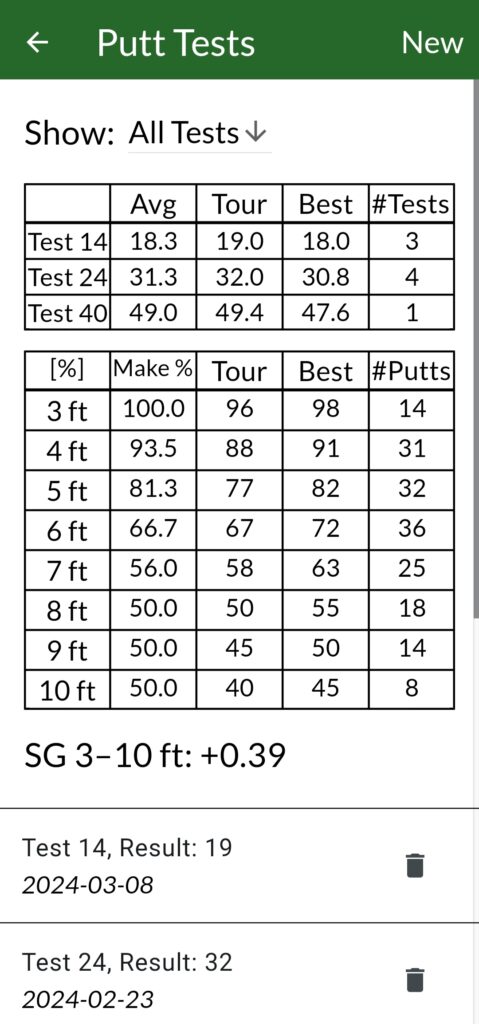
Figure 5: Sample for the wedge test statistics page. Score is a metric for estimated score relative par for a full test or a single shot from a distance range. μ is the tendency of hitting long or short of the target (long positive & short negative). Std is the standard deviation. Avg is the average miss. #Tests/#Shots is an indication of sample size.

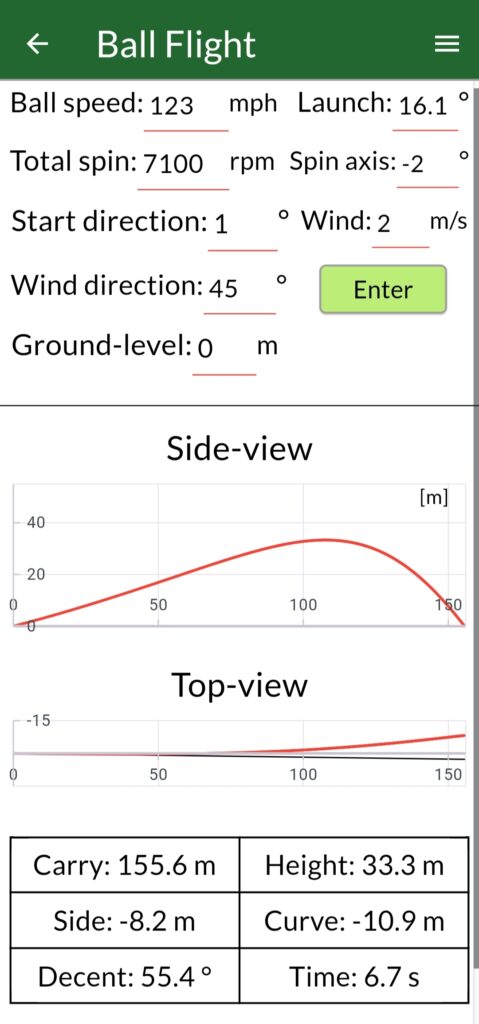
Figure 6: The ball flight program shows what would happen to a slightly drawing “7-iron” in a 2 m/s wind from 45° into and of the right enforcing the draw and reducing carry.
