The ball flight is a physical phenomenon witnessed by golfers endless of times. It is however very seldom related to in context of the aerodynamics and forces involved in describing the ball flight. This article aims to give a solid foundation to the physical background of the ball flight, so that every golfer can relate changes in the ball flight to the physics causing it.
The supporting physics for the analysis can be found in the appendix.
Analysing flights in the wind
To predict ball flights under the influence of wind, we first need to define the wind that will be used. In this analysis, a standard wind profile where the wind speed increases with distance above the ground will be used (see Appendix for full description). By adding the wind speed to the the ball speed a ball relative air speed is given. This relative value is the speed of the air passing over the ball and is the speed that give rise to the drag and lift force.
Following is an analysis for how a PGA average 7-iron is affected by a 3.5 m/s wind speed profile seen in Figure 8 in the Appendix. From there we, then compare how a knocked-down shot, modelled as a LPGA average 5-iron, would perform under the same conditions and apply knowledge about drag and lift forces along with wind profiles to explain what it is considered as an efficient flight for windy conditions.
The launch conditions for the PGA average 7-iron and LPGA average 5-iron is based on the updated Trakman averages (2024). For the two flights the LPGA 5-iron has a lower ball speed, lower launch angle and less spin. The specific values used can be seen in Table 1.
| Ball speed [mph] | Launch angle [°] | Spin rate [RPM] | |
| LPGA 5i | 114 | 14.6 | 4970 |
| PGA 7i | 123 | 16.1 | 7120 |
In the Club Selector in tGAT, it is possible to get club selection recommendation and “Play As” distance for different conditions. For a 140 m shot with a 3.5 m/s headwind, the Club Selector recommends the PGA 7-iron and LPGA 5-iron which we have data for above.

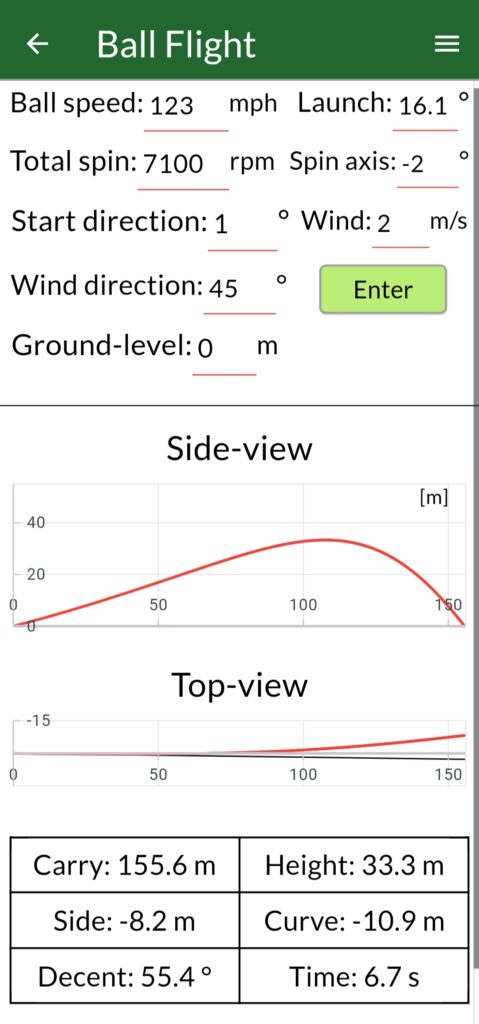
Initially, on the left in Figure 1 it is possible to see that the LPGA 5-iron only play the wind condition as ~8 m extra whereas the PGA 7-iron play the shot as ~14 m extra. Now, if comparing the two shots in the downwind situation of 3.5 m/s using the Ball Flight page in tGAT, two new shots are given (Figure 2).

In this situation we have a similar result. The LPGA 5-iron gain another 4-5 m carry from the stock distance with no wind of ~148 m, and the PGA 7-iron gain ~10 m of carry from the no wind carry. The result is summarised in Table 2 and 3.
| LPGA 5i | Headwind | No wind | Downwind |
| Carry | 140 m | 148 m | 152 m |
| Height | 23 m | 21 m | 19 m |
| Descent | 48° | 40° | 34° |
| PGA 7i | Headwind | No wind | Downwind |
| Carry | 140 m | 154 m | 164 m |
| Height | 33 m | 30 m | 27 m |
| Descent | 57° | 48° | 41° |
When looking the carry distances, it is noted that playing into the wind “hurt” more on distance. This effect is often spoken about in golf but for this specific case, the LPGA 5-iron goes ~8 m shorter into the wind and ~4 m further downwind. Additionally, the PGA 7-iron has the corresponding values of ~14 m shorter into the wind and ~10 m further downwind. A smaller difference in carry for headwind contra downwind is prefered from a wind predictability perspective. For instance, lets assume the 140 m shot into the wind is played for the two ball flights. If the wind were to stop mid flight with the LPGA 5-iron the carry would only overshoot with ~8 m instead of ~14 m with PGA 7-iron. More added benefits of hitting the low flighted shot will be discussed in the next section.
Next, consider the peak height for the different conditions. When playing into the wind the peak height increases which also give a steeper descent angle. With a high descent angle it is very easy to stop the ball quickly on the green. Thus, for the downwind condition were the peak height is lower, reducing the descent angle, the LPGA 5-iron will struggle holding the green with only 34° of descent angle. But, similarly to before, the difference in carry for the LPGA 5-iron is significantly less which makes it easier predicting the shot length in unpredictable wind.
To summarise, when playing into the wind it is beneficial to reduce the ball speed, launch angle and spin rate in order to have a small difference in carry distance if the wind strength changes unpredictably. Furthermore, with the headwind the descent angle is increased which makes it possible to hit lower shots and still retain stopping power on the green. In contrast, downwind conditions are more governed by the amount of green available. That is, hitting a higher shot may be necessary to give the ball a chance to stop even though the carry distance become more unpredictable for the higher flight.
Benefits of the low ball flight in wind
Why the lower LPGA 5-iron is more efficient in the wind comes down to a hand full of effects. Firstly, the wind profile indicate that a potential error in our estimate of the wind strength or direction is magnified if we hit it higher as the strength of the wind increases with height. So, by hitting it lower there is less wind which can have an affect. One efficient way to reduce the height is to reduce the spin rate. This have a two fold effect: reduced CL, which means reduced lift force that pushes the ball up, but also reduced CD, as CD decrease if the spin is reduced. This reduce in CD is what makes the ball fly “through” the wind better in for example flyers. The next way to reduce the height is to simply decrease the launch angle. An added bonus to this is that the ball has a higher speed through the top part of the flight which means that it spend less time in the strongest wind. That is, less time at the part of the flight where it is the most subjected to the wind but at the same time the ball has a slightly higher speed at that location which reduces the CD and give it more of a “fly through the wind effect”. Lastly, by reducing the ball speed we have the added benefits of reducing the lift force through the first half of the flight and keeping the ball lower as an effect. It also keeps the ball lower as its initial vertical speed is less and thus less force over time is required to get it flying downwards by Newton’s second law of motion (ΣF = ma).
As mentioned before, the use of this shot comes down to when the descent angle allows for it. For softer greens which are deeper front-to-back and preferably also with slope towards the line of play, a shallower descent angle can still work. If the situation of the green is the reverse, arguments dictate that the launch, spin, and ball speed should, if necessary, instead are increased to give a descent angle with the possibility of stopping the ball.
Ball flight in tGAT
In tGAT the ball flight model also include components that makes it possible to analyse effects in 3D. The wind direction can be turned a full 360° around, ground-level can be altered to simulate uphill or downhill approaches and start direction and spin axis makes it possible to create draws and fades.
Appendix
The supporting physics recommended to fully grasp the ideas and concepts presented in the analysis.
Governing equations
The main equations that will be used to describe the flight of the ball will be introduced in this section and then referenced to when discussing flight characteristics later on.
Firstly, we have Newton’s second law of motion which states that the sum of the forces acting on an object is equal to it’s mass multiplied by it’s acceleration. ΣF = ma. From this equation we can get the acceleration of the golf ball which, taken over a time, will give both the ball’s velocity and position.
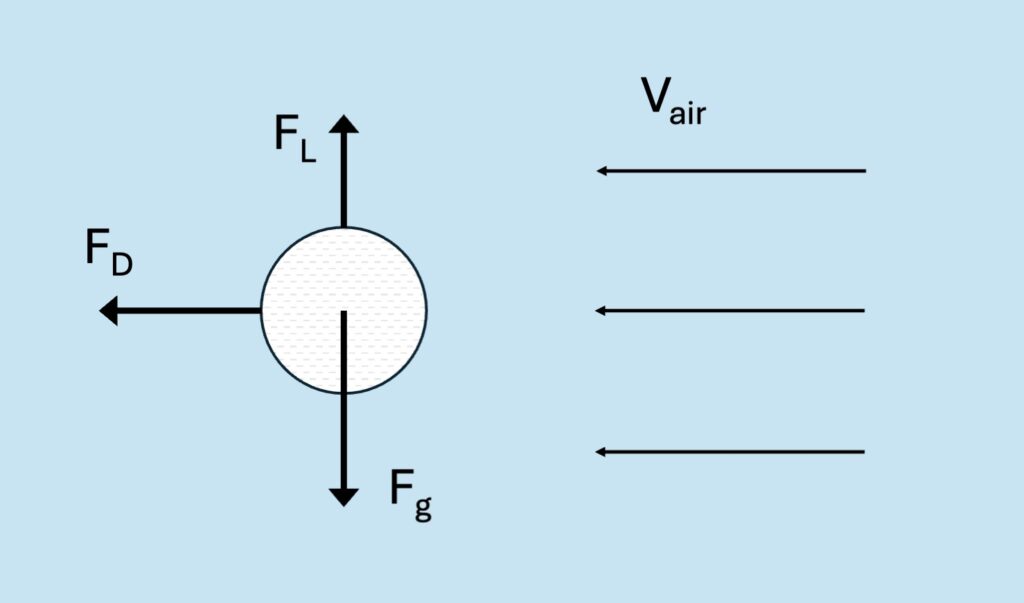
Secondly, we need expressions for the different forces acting on the golf ball to solve for the acceleration mentioned above. In this analysis we will stick to three forces. The drag force (air resistance), lift force (generated from spin and generally referred to as the Magnus effect ) and the force of gravity. The force from gravity, Fg, is simply Fg=mg, where g is the gravitational acceleration. The drag force, FD, can be expressed as FD=½CDρAV2 and acts in the opposite direction of the velocity. Where V is the speed of the ball relative the air, A is the cross-sectional area exposed to the wind face-on, ρ is the density of air, and CD is the drag coefficient. Similarly, the lift force, FL, can be expressed as FL=½CLρAV2 but it acts perpendicular to the velocity. CL is here the lift coefficient and A is instead the cross-sectional area viewed from the top (because of symmetry of a golf ball both areas are equal to the area of a circle A=r2π with radius, r). Figure 4 show the force diagram for the forces discussed above.
As both the drag and lift coefficients for different bodies varies with the Reynolds number, Re, I’ll briefly mention it. Reynolds number is the quotient of dynamic forces and viscous forces, Re=ρLV/μ. Here L, is a characteristic length (for a sphere its the diameter), and μ is the dynamic viscosity of air. Since we are only discussing golf balls I’ll use standard air assumptions and discuss the lift and drag coefficients in respect to ball relative air speed in mph.
| r = 0.02135 m |
| m = 0.046 kg |
| g = 9.81 m/s2 |
| ρ = 1.2 kg/m3 |
| μ = 18.1×10⁻⁶ kg/ms |
Closer look at CD and CL
The force diagram in Figure 4 for a golf ball is actually the same force diagram that you would get for an airplane wing. But for the golf ball, the lift is generated though backspin whereas the wing generate it from its wing profile. This means that their flights would by all means not look the same and, hence, something must separate the golf ball from the wing. So, the two parameters that can vary between the two different cases, to give the unique flights, is the lift coefficient (CL) and drag coefficient (CD).
By looking at experimental data it is possible to get a good idea for how CD and CL will change depending on speed and spin rate. With these values, it is possible to create a model that predicts ball flight fairly accurately.
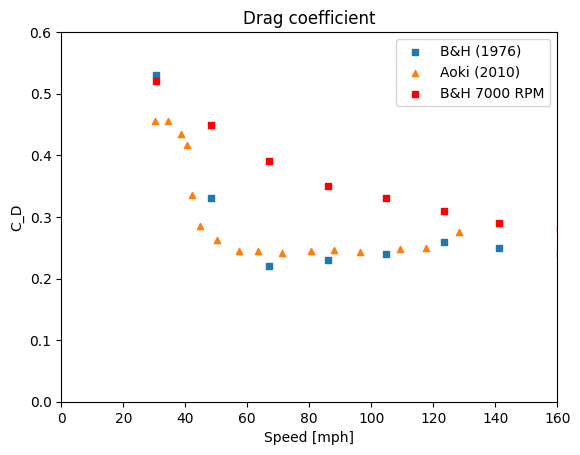
The drag coefficient is plotted against the ball speed in Figure 5 for experimental data gathered by Aoki et al. (2010) for zero spin and also Bearman and Harvey (1976) for zero spin and spin of 7000 RPM. What can be seen in Figure 5 is a noticeable decrease for CD at around 60 mph for zero spin. This has to do with the aerodynamics of the dimples that cause the airflow to transition from a laminar flow to a turbulent flow. For a blunt object such as a sphere, turbulent flow help reduce the size of the wake created behind the ball which is a considerable contributor to the drag force. In comparison, a smooth golf ball will instead transition to turbulent flow at around 230 mph, which is why they fly considerably shorter. What can also be seen in the experimental data is that the drag force increase with an increase in spin rate.
An effective method for displaying how CL change with speed and spin rate is to plot CL against the quotient for spin/speed [RPM/mph] as seen in Figure 6. What the data show is a close to linear relationship between the quotient and CL. This means that if the speed is held constant, an increase in spin rate linearly increase the lift coefficient. On the other hand, if spin is held constant an increase in speed would linearly reduce the lift coefficient. (The CD values follow a similar tren in this sort of diagram).
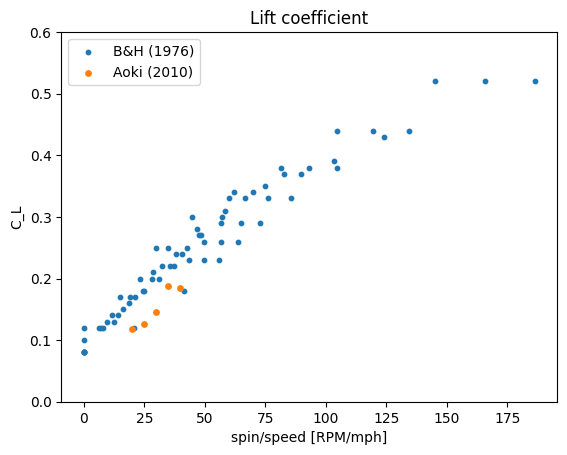
A few important take-aways from figures 5, 6 and the equations above. Firstly, from own preliminary computational fluid dynamics simulations it has been seen that the spin rate reduces with less than 5% for entire duration of the flight. In contrast, the speed reduce substantially more the first half of the flight before the speed plateaus, the lift coefficient increase for the first half of the flight and then also plateaus. Secondly, the latter half of the flight is usually below 60 mph which means that the drag coefficient is a lot higher that half. This is what makes it possible to hit mid irons which fly far but still comes down soft with a steep descent angle. Lastly, even though both CD and CL have higher values for the second half of the flight, the size of FD and FL is less because of the lower speeds. An example, the PGA 7-iron has a ball speed of 123 mph and spin of 7120 RPM at launch and at around the top part of the flight the speed has reduced to around 45 mph and the spin to around ~7000 RPM. By looking at Figure 5 and using the data for 7000 RPM for CD we get our CD for initial launch to 0.3 and at around apex to 0.45. Figure 6 give CL for launch to 0.3 and to 0.45 at around apex. If we then convert our speeds to m/s and plug our numbers into our drag and lift force equation we get the following forces. FD at launch = 0.78N, FL at launch = 0.78N, FD at apex= 0.16N, FL at apex = 0.16N. The big difference in the size of the force comes from that the speed is squared in the equations and thus affect more. (That CD and CL had the same values at launch and around apex is more of a coincident than rule of thumb). For comparison of forces, the force from gravity Fg = 0.45N which means that the ball will climb in the beginning as FL at launch is greater than Fg.
Wind
As noted earlier, the speed of the ball has the greatest effect on the forces acting on the ball. So far we have only discussed the ball speed with no external wind effect but as golf is usually played subjected to the elements we need a way to incorporate it in our prediction.
Below 100 m the strength of the wind can be approximated by a logarithmic wind profile where the strength of the wind increases with height (The Swiss Wind Power Data Website, n.d.). Below is the equation used.
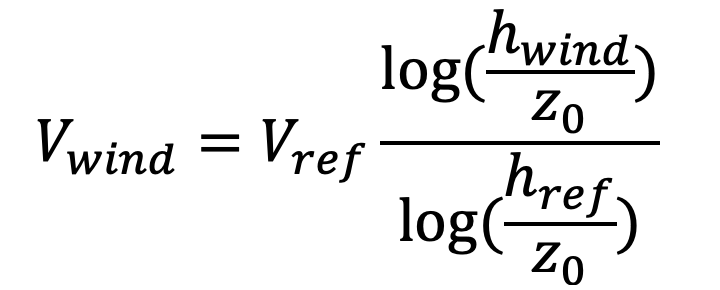
In the equation Vwind is the wind strength at a certain height, hwind. Vref is a known wind strength at a reference height, href, which is 10 m for weather app data. The last variable z0 is a roughness length which is an approximation of the terrain (z0 is set to 0.04 m which is an estimate for an open golf course with few trees).
Figure 8 show what the wind profile look like for a 3.5 m/s wind for the first 40 m above the ground.

References
Aoki, K., Muto, K., & Okanaga, H. (2010). Aerodynamic characteristics and flow pattern of a golf ball with rotation. Procedia Engineering, 2(2), 2431–2436. https://doi.org/10.1016/j.proeng.2010.04.011
Bearman, P. W., & Harvey, J. K. (1976). Golf ball aerodynamics. The Aeronautical Quarterly, 27(2), 112–122. https://doi.org/10.1017/S0001925900007617
The Swiss Wind Power Data Website. (n.d.). Wind Profile Calculator. https://wind-data.ch/tools/profile.php
Trackman. (2024). Trackman tour averages. https://www.trackman.com/blog/golf/introducing-updated-tour-averages
Further reading
In the book The science of the perfect swing (2015) the author Peter Dewhurst looks further into how wind effect the ball flight. Covering the topics such as the effect on directional components from headwind, downwind and crosswinds but also a lot more golf related content.