Green Reading YouTube tutorial series can be found here
The tGAT reading system is based on calculated aim from a numerical model using on the four green reading parameters: distance, slope, elevation and stimp. With these four parameters it is possible to very accurately predict aim for any putt. What is achieved using the tGAT green reading system is a straight-forward approach for predicting aim very closely to the aim generated by the model on the course with no aid. (More information about the four green reading parameters is given in the “apply it on the course section”.)
Firstly, in order to understand the tGAT reading system, we haft to have a grasp for the definitions and terminology used.
| Distance: | Measured distance in meters from the ball to the hole. |
| Slope: | Incline of green side-to-side measured in percent. |
| Elevation: | Incline of green uphill/downhill measured in percent. Positive defined uphill. |
| Stimp: | Unit for green speed. Defined as roll-out distance with a stimpmeter. |
| Aim: | Measured in centimeters from the center of the hole. |
Simplifying the model output
By knowing the definitions we can interpret a table output from the numerical model like the following for stimp 10 and elevation 0 %. The putts are hit with a speed that takes the ball 45 cm past the hole (if it where to continue rolling without hitting the hole).
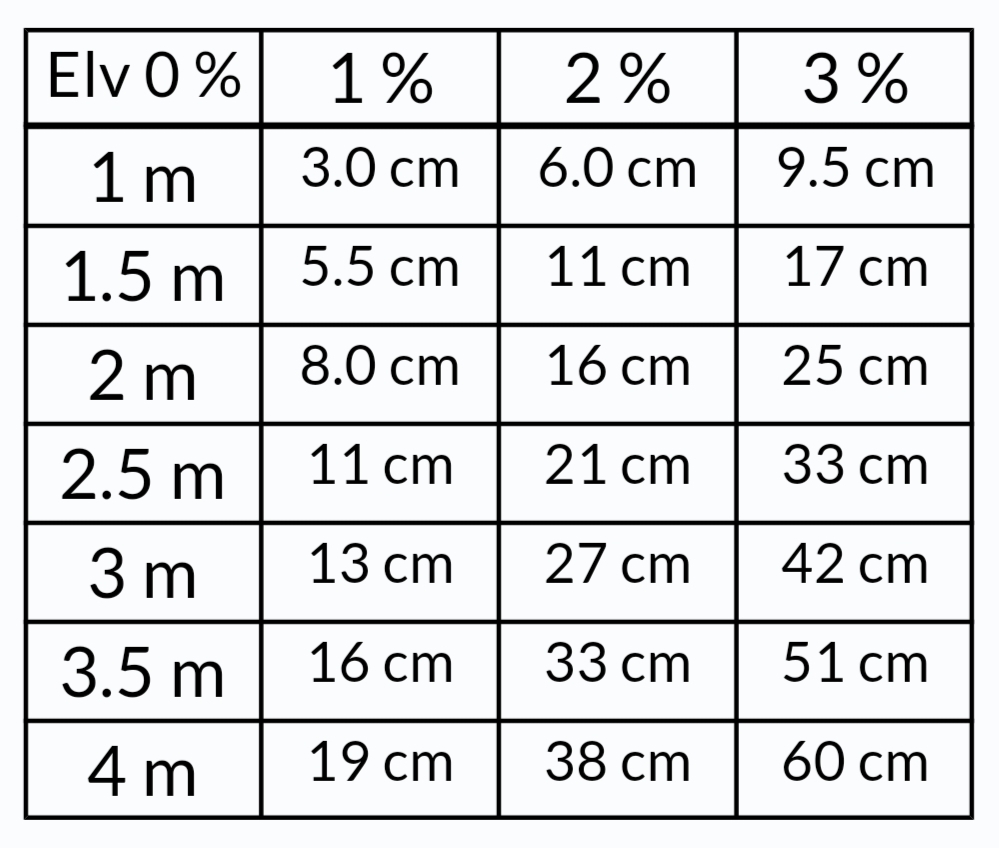
For each row down, the distance is increased by 0.5 meters and for each column the slope is increased by 1 %. The above table can be rewritten in a simplified form by applying two steps. This way it can be used on the course.
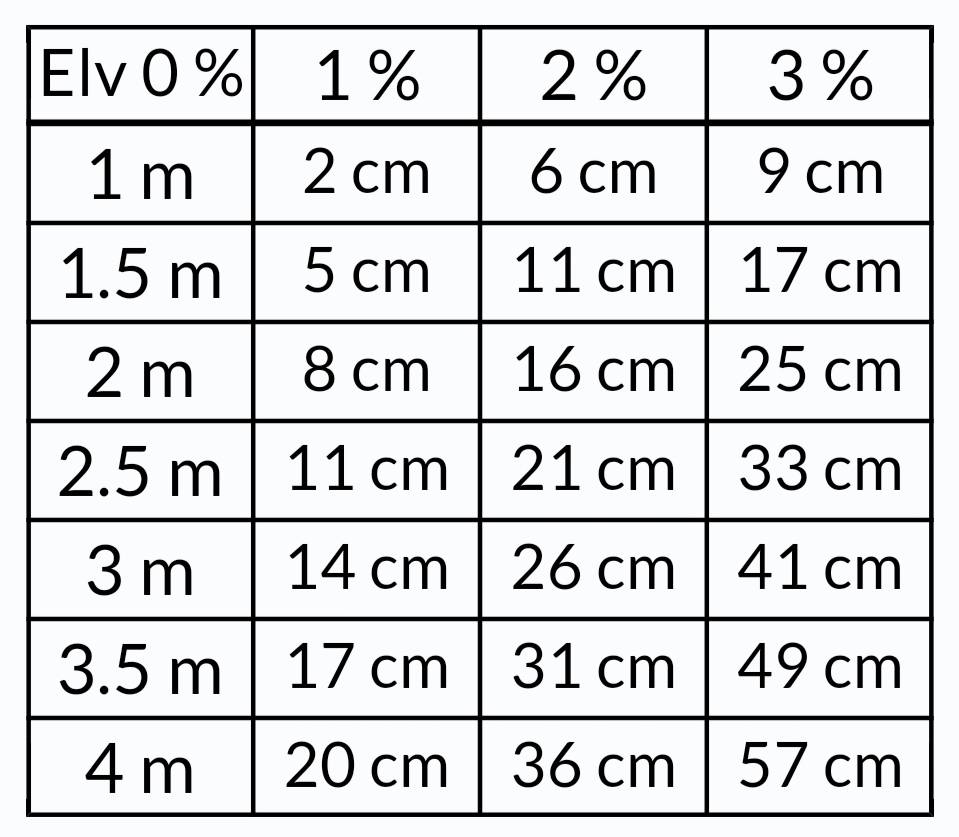
Note that aim is always within 2 cm from the actual values in Table 2.
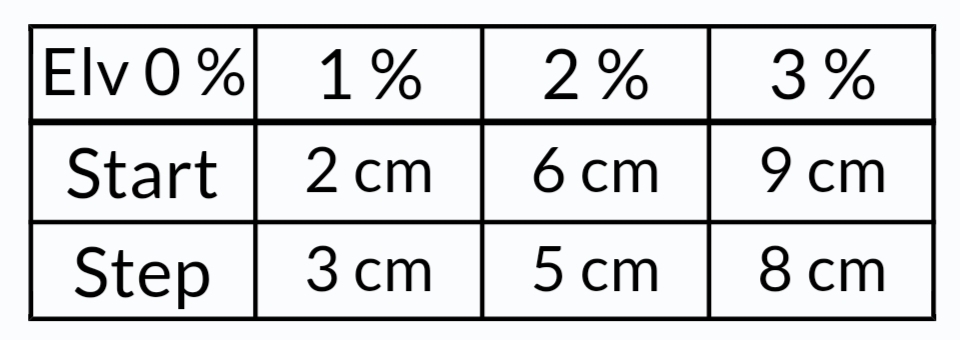
After simplification step 2 we only have two numbers per column which contain all information needed to create the entire table from simplification step 1. It works like the following:
Start is the aim used at 1 m. Step is the additional break for every 0.5 m more than 1 m.
Example: To get the aim for a 3 m putt at 1 % slope we do the following:
Start gives us 2 cm for a putt with 1 % slope and distance of 1 m. As we want 3 m we need to add two more meters (or four more 0.5 meters). With our Step of 3 cm we multiply by four that is 3×4=12 cm. Then we add our Start of 2 cm and get 12+2=14 which is the value found in Table 3.
Alternatively it is possible to write this process as an equation.

This can be repeated for all values in Table 3 from the Start and Step parameters. Likewise can be done for table with different elevation and stimp. This means that we can generate condensed tables with all Start and Step parameters for a stimp value which then can be used for practice purposes.
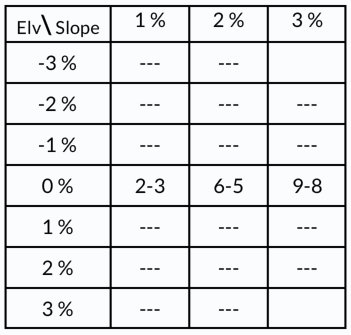
Here the first value is the Start parameter and the second our Step. (Because of regulations tables with calculated aim is not allowed in higher levels of tournament golf but through the practice methods mentioned in the next section, this is easily circumnavigated).
Practicing reading
The first step is to select the stimp which most closely correlate to the green speeds that you normally play on. Your available stimp options range from 8–13. From one stimp it is easy to convert up or down one unit in stimp, that is to go from stimp 10 to stimp 11 or down to stimp 9. Tips for figuring out the stimp is mentioned in the next section but the proceeding green reading process is identical for all stimp values.
The second step is to get familiar with the condensed simplified table. Easiest way for this is to use the inbuilt Practice Tables feature in tGAT.
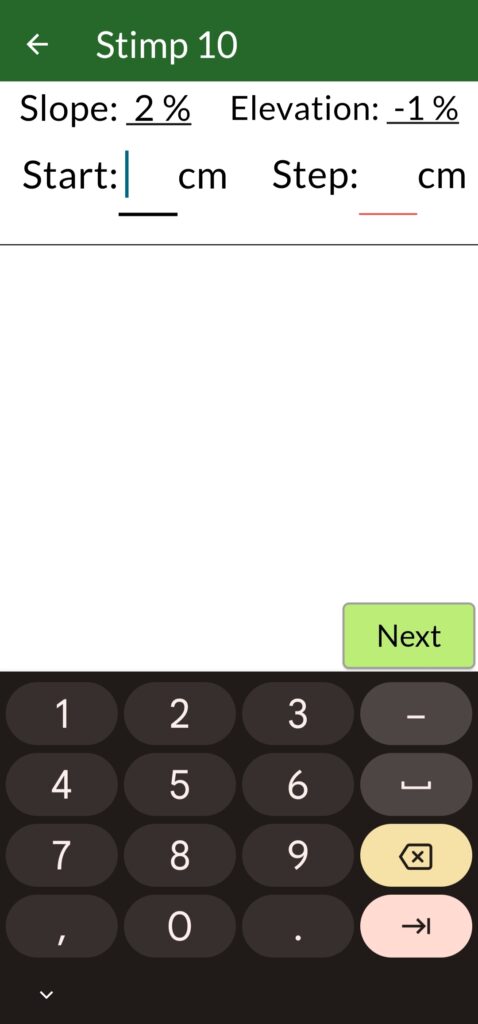
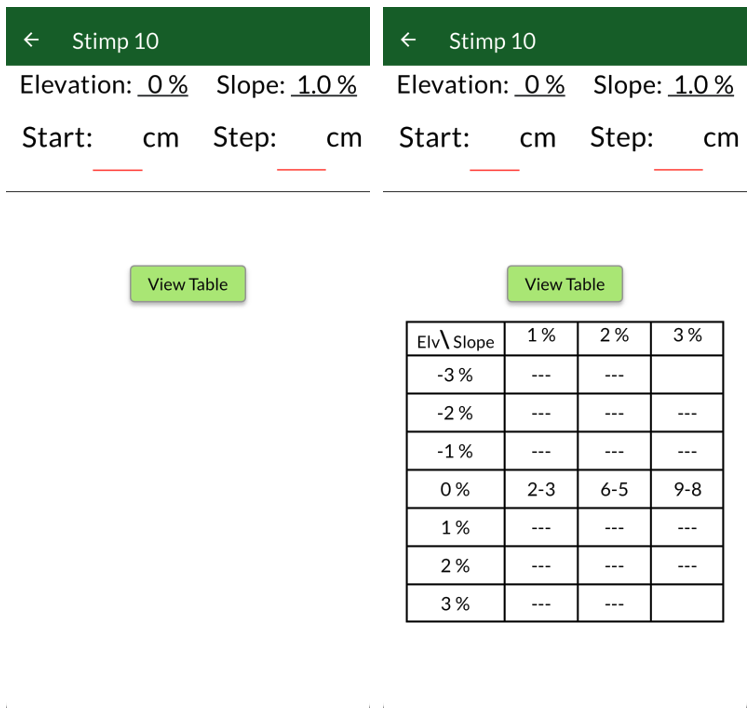
In Practice Tables you can decide the stimp you want to practice and the order that the slope and elevation combinations will be presented in. You can practice them column by column, row by row or practice them in a random shuffle. When guessing wrong you get the possibility to view the condensed simplified table as a refresher.
After getting comfortable with the simplified table, the next step is to start practicing green reads. This can be done through the Practice Reading page in tGAT. On this page, you are presented with the four green reading parameters (distance, slope, elevation and stimp) and the objective is to guess the correct aim.
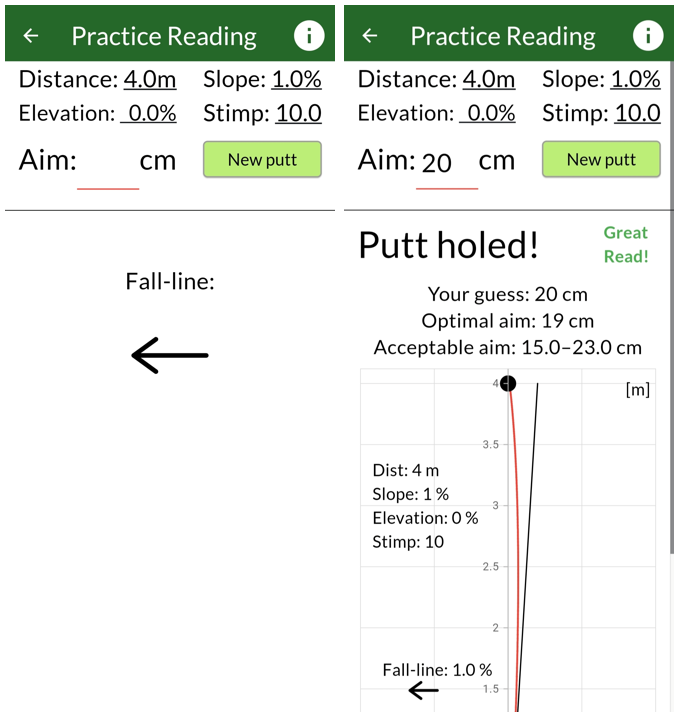
This you can either practice in a free-play mode or in a standardized test where you can track your progression in metrics such as points (based on accuracy and time), putts made, great reads and time per read.
Apply it on the course
To apply it on the course, one only needs to evaluate the four green reading parameters (distance, slope, elevation and stimp) for the putt.
To evaluate the stimp multiple methods can be used. The first way to do it is by asking the greenkeeper of the course you play at. A second alternative is to find the aim needed for a putt with considerable break by trail and error and then use tGAT to find what stimp value give the same aim. A third option is to buy a stimpmeter or a Stimp Rail which can measure it directly. After putting on a lot of greens with known stimp you’ll quickly get a good sense for it by feel alone.
With the stimp known before going out on the course, only distance, slope and elevation needs to be figured out while playing. Distance is measured by simply stepping out the distance of the putt. This leaves slope and elevation which can be evaluated by a few different methods as exemplified below.
Method 1: By using your feet it is possible to learn to recognize slope in percentages with some practice. This means that you can for putts less than 2 m take one slope reading while straddling your line and then turn 90° to take the elevation reading. Then the aim can be calculated. For putts over 2 m it is recommended to take the slope reading at two equally spaced locations for your putt. The value used for the calculation will be the average of the two slope measurements. Elevation needs to be weighted to give a better estimate so take one measurement at 2/3 of the way to the hole. To calculate the aim it is recommended to keep the elevation as a whole number and use slope to a half percent precision. (This approach gives a good approximation even when assessing more complex putts with the numerical model, see 2-plane green reading).
Method 2: This method uses instead a visual evaluation for slope and elevation. Here you apply the same steps, first take out the slope and elevation. Then proceed with calculations for aim.
Any combination of the two method also works. One popular variant is to measure the slope by feel and then doing the elevation estimate with a visually. This saves some time in the green reading process and as the elevation estimate is less important, it makes a small difference with accuracy for people that are better at estimating slope with their feet. Personally, I focus on getting one slope read with my feet as accurately as possible at the middle of the putt. I then use my eyes to fill in any changes in the slope at the beginning or end of the putt and add an estimate for the elevation (here I’m using principles from 2-plane green reading to make the best possible conversion of slope and elevation for the calculation).
To calculate aim when using slope of 0.5, 1.5, 2.5 or 3.5 % slope, there are 4 good approaches. First approach is to calculate the aim for rounding down the slope and then to the same for rounding up. These two aim values can then be averaged. This method works great if you have a caddie to do the second calculation. The second approach is to divide the aim for 1 % by 2 to get aim for 0.5 %, add 50% to the aim of 1% to go to 1.5% slope, add 25% break to get from 2% to 2.5% slope and add 20% break to go from 3% to 3.5% slope. For the third approach, you need to learn an extended simplified table with additional columns for half percent slope. The last approach uses a relationship where you can convert the putt to a standard case by either decreasing the slope by 0.5 % and then decreasing the elevation by 1 % or by increasing both by the same said amounts. This estimate is however only accurate for putts with more break so take a look at the extended simplified table to see when this applies.
In order to determine whether estimating slope with your feet or visually works best, tGAT has an Estimate Slope Test where you can both test your skill in predicting slope with your feet and with your eyes. By completing multiple tests a statistical profile for your slope predicting skill with each method will give an indication for what works best. This is the process.
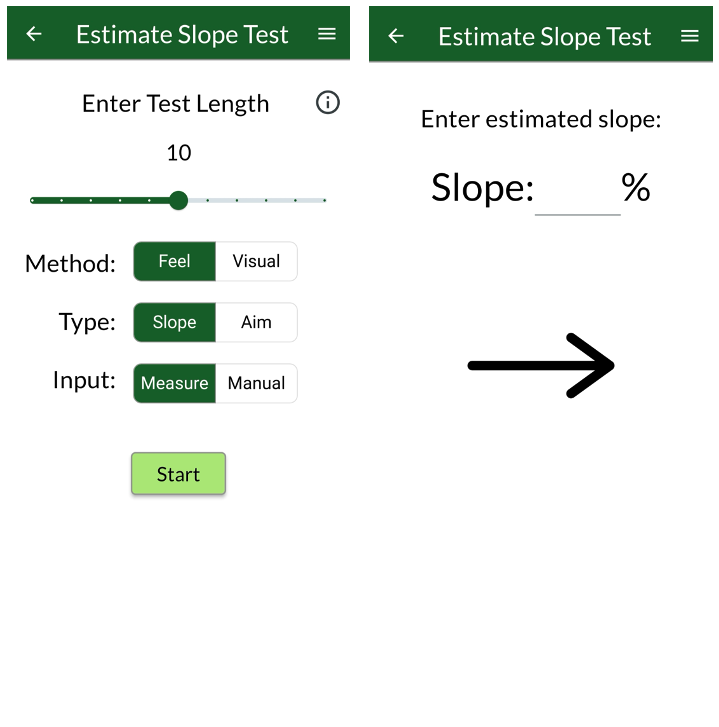
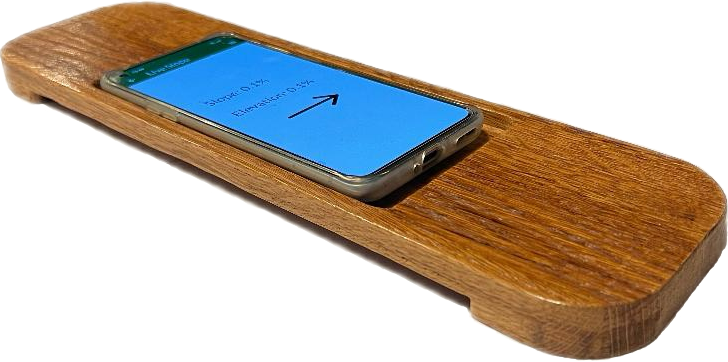
Start by configuring the test by selecting number of slope estimates to be taken. Then choose whether you’ll use your feet or eyes. Next you can decide to do reads by guessing the slope or by guessing the aim for a putt (if you choose aim it is recommended to only do reads on putts of 2 m or shorter). You can then decide if you want to measure slope on the green with your phone or alternatively use a digital spirit-level and enter the slope manually. With that set up, the next step is to enter a guess for slope (or aim) at a random location on a green and then let your phone evaluate the actual slope. The arrow is to be pointed forward to get the reading in the correct direction when measuring with the phone.
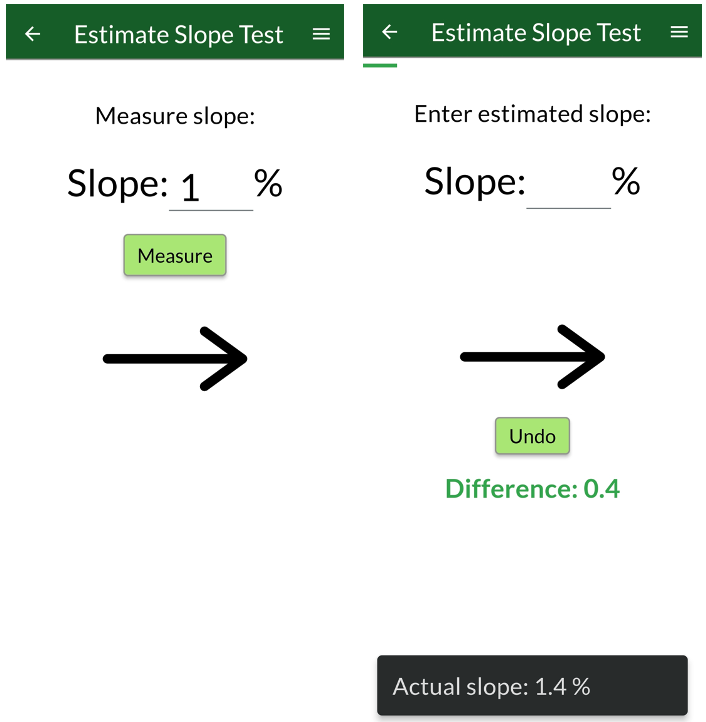
Note: It is recommended that when doing a feel based test with your feet that you measure at a location on the green where you haven’t looked to avoid your eyes to subconsciously to read the putt. Furthermore, one can use a Slope-plate to get a slope reading for the points your feet stand on instead of a very local point in-between. This gives a better correlation between your feel and the measured value.
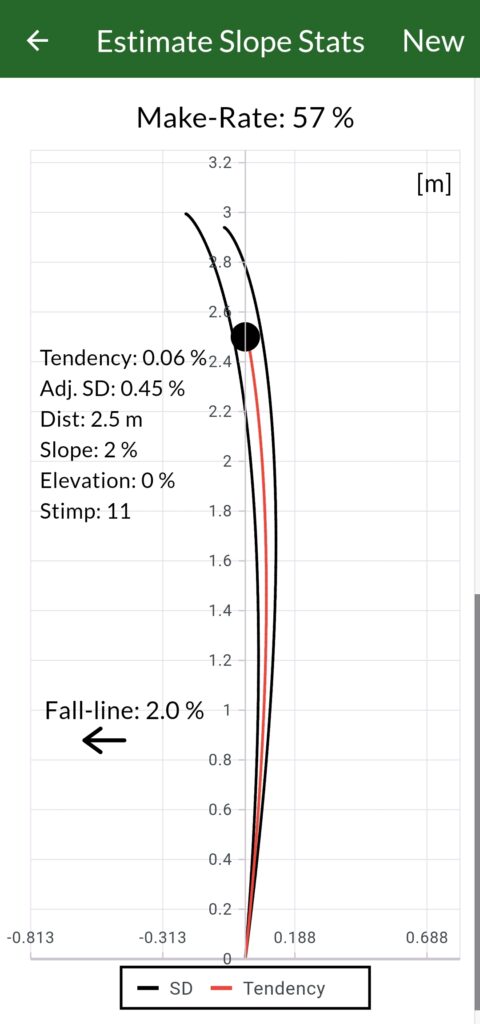
By completing both visual and feel tests you can get two separate reading profiles for predicted on-course green reading accuracy. What is shown in the green reading profile, as seen in Figure 6, is different make-rate predictions for different putts and what a standard deviation of slope and elevation miss-read will be placed in relation to the reading tendency. The green reading tendency is preferably close to zero and can both be expressed in left-or-right miss or in over-or-under reading terms. As reference for standard deviation (SD) for slope miss-read, an elite golfer has a SD of 0.44%.
The very last step is to learn to accurately pin-point where the calculated aim is located in relation to the hole. To do this, using the hole diameter as a reference work effectively for aim less than 30 cm. The diameter of the hole is about 11 cm which means that the edge of the hole is at about 5.5 cm. Combining these give a good approximations for where to aim. For putts with a calculated aim above 30 cm, one can use a check-point method. An example for how to do this is to practice finding 50 cm and 100 cm with precision. From there you can then add or subtract hole diameters to find aim in-between.
| Aim [cm] | Aim [cups to edge of hole] |
| 5.5 | 0 |
| 11 | 0.5 |
| 16.5 | 1 |
| 22 | 1.5 |
| 27.5 | 2 |
Final words
To get started with this green reading method, it will take some initial work. That is, without knowing the simplified table one can not make a prediction for the aim. But when knowing the table, you can accurately predict aim for any putt and the work to get there is comparable to just learning 3–4 phone numbers. Only thing is that the Practice Tables feature in tGAT structures it in a way that probably makes it even easier than that. Additionally, as learning the tables and then make aim predictions for reads all can be done through the app, you can do all of that work off-course.
The green reading method also work for cases that has not been covered. For example, putts above 4 m can be predicted by imagining that the table extends further (the numbers in the simplified tables are optimized for the 1–4 m range but are still good predictions for longer putts). Another example is wind which is a factor that can play a major role in deciding the correct aim. The process for covering this entail learning a new small set of start and step values for wind deflection. These numbers can then be adjusted and added to the aim prediction from slope and elevation. More info is found in tGAT.
Lastly, learning the simplified tables and making accurate aim predictions is still the easy part of green reading. What is tricky, is to actually find the slope and elevation to make your aim prediction on. Here it is important to keep your eyes open to both the feel method and the visual method as the both come with pros and cons. The feel method works equally well on different courses as course specific visual illusions is negated. However, windy days may cause wind biased reads and fatigue can also negativley impact your ability to feel slope. This is where the visual method can compliment the feel method. Furthermore, as a visual approach is the standard for evaluating break, it requires less of a transition for most golfers.
Note: To then make the putt is helpful to hit good putts with the correct speed. Also, as golf is an outside sport, there will always be factors that we cannot predict, but by using the proposed green reading method you will at least know that you cannot make a better green reading prediction.
Further reading
In this post its possible to dig deeper into how to read putts with a more complex geometry.
The post, What is the best way to improve your putting? takes a look at how green reading, start direction and distance control affect your putting skill.

2 thoughts on “Reading greens with tGAT”