Motivation: In order to lower ones score the first step is to avoid bogeys and worse. This is mostly a matter of strategy covered by for instance Mark Broadie in Every Shot Counts and Raymond Floyd in The Elements of Scoring. The next step is to make more birdies. This can be done by being on the green of par 5’s in two and thus two-putt for birdie. Alternatively, hit approach shots close to the pin to have to have a realistic look at birdie. The second option is what will be covered in this article.
Firstly, your approach accuracy is defined by a dispersion pattern. This pattern is found by tracking where each shot end up in relation to the target and then displaying it as a scatter plot. What you will found traditionally with enough data is an oval pattern with a designated height and width. When looking at different players dispersion with different clubs there is a usual tendency. With irons this pattern has a larger width and a narrower height. That is, the distance control is easier than the directional component. In comparison, wedges usually have the inverted pattern of a larger height and narrower width, correlating to better control of direction than distance. The factors involved in this phenomenon is further discussed by Dave Pelz in Dave Pelz’s Short Game Bible and the direction control component is covered by Peter Dewhurst in The Science of the Perfect Swing.
As just hitting closer to the pin doesn’t necessarily make a significant indent in scoring, we preferably put our focus where improvement help the most. For example, by using strokes gained statistics we can see how much 2 m closer to the pin can reduce the score. If that approach is improved from 10 m to 8 m, this saves about 0.06 shots whereas that improvement from 4 m to 2 m saves about 0.33 shots (this effect is connected to make rate probability for putts of different length and is discussed by Mark Broadie in Every shot counts). Over the course of many shots these numbers compound to save full shots. What can be seen is that hitting inside 3 m is what will help the score the most and the only way to realistically do this repeatedly is with a wedge in the hand.
From our knowledge of wedge dispersion patterns, we have that improved distance control has the greatest potential of shrinking our pattern and get us closer to the pin. For this reason, the wedge tests in tGAT specifically target wedge distance control.
The Tests: At the moment there are 4 different tests available with different distance ranges. All tests consist of 10 random distances that are constrained in a way to make each tests comparable and relevant. The goal for each test is to match target distances with a close wedge carry.
| Wedge Test | Description |
| Long | Distances from 60–125 m (or 66–137 yds). 10 constrained random distances. |
| Short | Distances from 50–105 m (or 55–115 yds). 10 constrained random distances. |
| Restricted | Distances from 45–85 m (or 49–93 yds). 10 constrained random distances. |
| Incremented | Distances from 60–125 m (or 65–135 yds). 10 constrained random distances of multiples of 5 m/yds. |
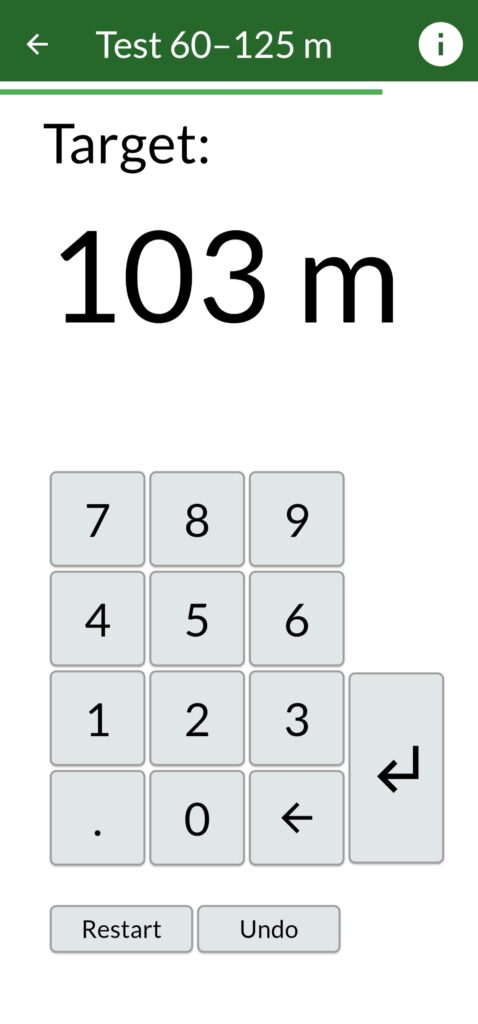
In Figure 1 it is possible to see the view for doing the long wedge test covering 60–125 m. The target for this specific wedge is to get a carry of 103 m. After hitting a wedge, that carry distance will be typed in and the test will give a new target distance.

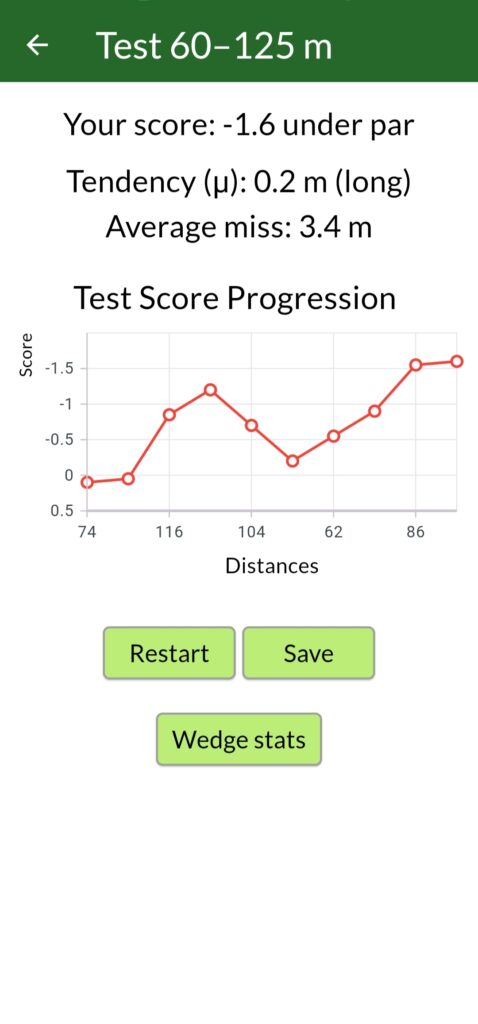
When the test is completed a screen showing the average distance to the pin, tendency (long or short of target) and score in relation to par is presented (Figure 2). The score metric is based on the distance component from the test, an expected wedge dispersion pattern for the directional component and based on strokes gained numbers around a tricky pin position.

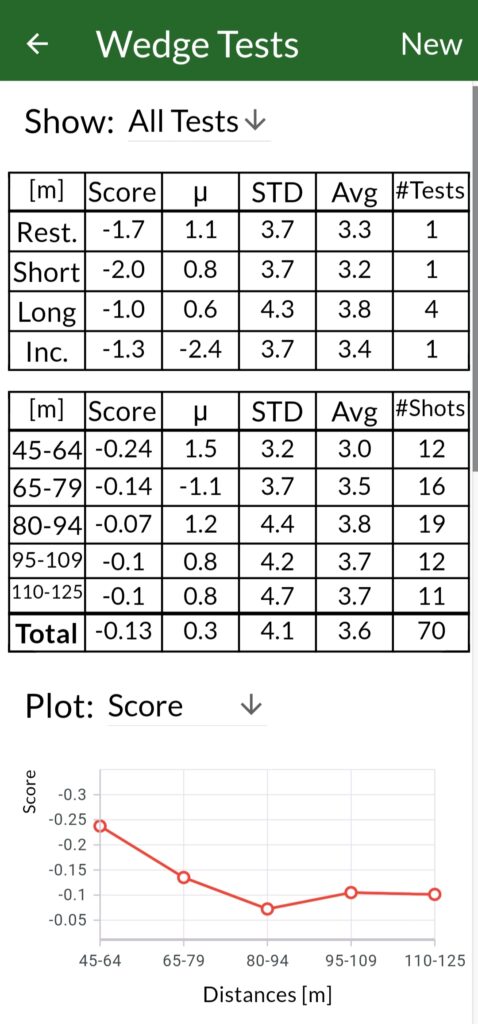
There is a combined statistics page for all completed wedge tests that present more data for wedge accuracy seen in Figure 3. This data is divided into two tables. The first show the data for each test type whereas the second table show statistics for each distance category. In these tables, score is the average score for the first table and score per shot for the second table. μ is the tendency long or short (long positive, short negative). STD is the standard deviation and the last column refer to the sample size.

Note: To complete a wedge test it is highly recommended to use a launch monitor. It is however possible to make it possible to fairly accurately determine carry without a launch monitor. This is how you can do it. Firstly, stick to the restricted or short test as it is easier to see the carry accurately from a shorter distance. Then, either hit in a slight uphill on a practice area with markers every 5 m in the target range (hitting in an uphill makes it easier to see the carry) or alternatively hit to a green thats low down with markers every 3 m around the pin and adjust the hitting area to get the target distance.
References
Broadie, M. (2014). Every shot counts: Using the revolutionary strokes gained approach to improve your golf performance and strategy. Avery.
Dewhurst, P. (2015). The science of the perfect swing. Oxford.
Floyd, R. (2000). The elements of scoring: A master’s guide to the art of scoring your best when you’re not playing your best. Simon and Schuster.
Pelz, D. (1999). Dave Pelz’s short game bible: Master the finesse swing and lower your score. Doubleday.
